Paul Krugman revisited the so-called “Great Resignation” and concluded it isn’t really a thing. You heard it here first. Thanks for the validation, Dr. Krugman, and for demonstrating the difference between calculating statistics correctly and interpreting them properly.
Sneering at statistics is a popular pastime, with lots of clever quotes from clever people to justify the derision, and high salaries paid to the data scientists who are good at it.
Statistics is hard to get right, even without the math. Failing to appreciate the stochastic nature of the world around us … that is, the randomness that’s intrinsic to so much of our experience … is a major reason so many of us so often draw the wrong conclusions.
Three examples, drawn from Daniel Kahneman’s brilliant Thinking, Fast and Slow, help illustrate just how easy misinterpreting statistical analysis is. Call them the bulls-eye effect, regression to the mean, and the small town fallacy.
Bulls-eye effect
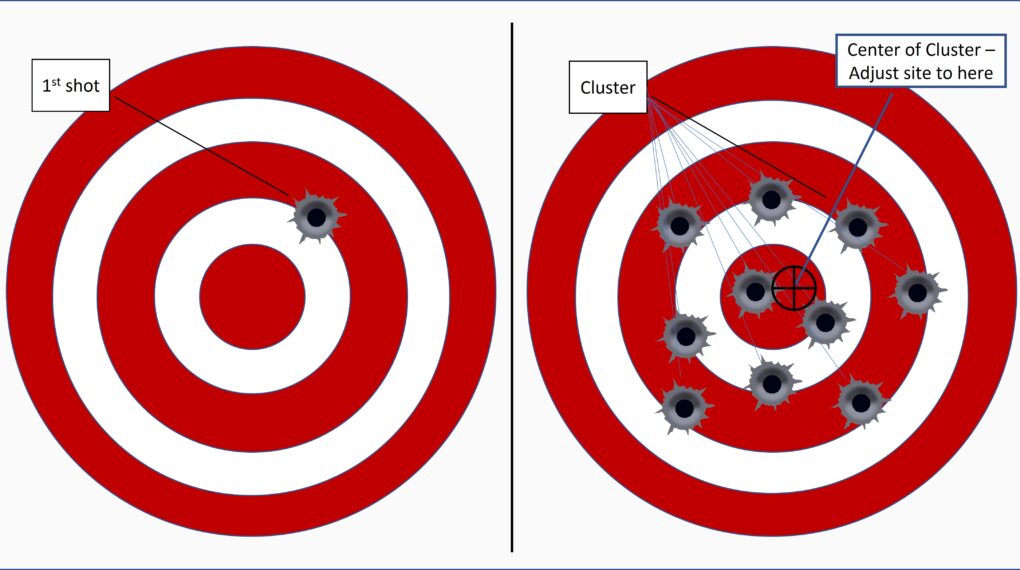
The bulls-eye effect is familiar to anyone who has ever sighted in a rifle. Here’s how it doesn’t work: (1) Put the rifle in a clamp; (2) pull the trigger; (3) realign the site so its crosshairs are pointed at the hole in the target.
Do this and pull the trigger again. This bullet won’t pass through the hole created by the previous one, and the next shot you fire probably won’t pass through either of the previous bullet holes.
The trajectory of a fired bullet is stochastic, affected by random effects. Slight variations in bullet weight, propellant quantity and composition, wind, barometric pressure, humidity, and so on all influence the path each bullet follows on its way to the target.
To properly sight in a rifle you need to fire more than one round – statisticians would recommend 30, but 10 is probably enough. Then, as Figure 1 illustrates, adjust the sight so it points to the middle of the cluster of bullet holes you produced. And, accept that whenever you use the rifle you won’t be able to perfectly predict where the next bullet will fly.
No matter which business process or practice you’re dealing with, perfection will elude you because to a greater or lesser degree, all processes and practices are subject to stochastic effects.
Regression to the mean
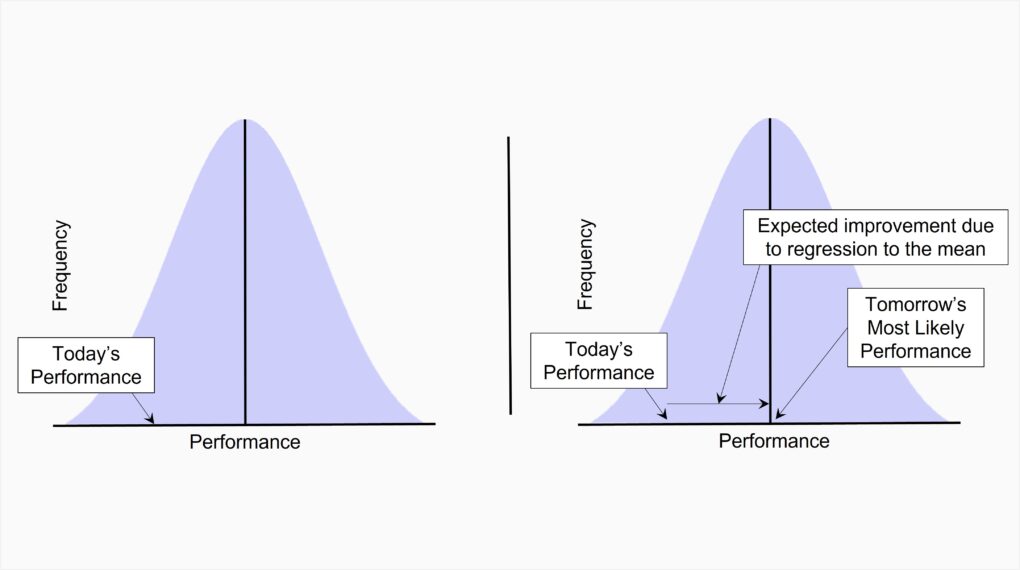
A team member does poorly at an assignment. You chew them out, and they do better at the next one. Another team member handles their assignment well. You provide positive reinforcement … you compliment them. Nonetheless they do worse their next time out.
You draw the obvious conclusion: Negative reinforcement works, positive reinforcement doesn’t. And … you drew the wrong conclusion. As shown in Figure 2, if today’s performance is below average and performance is stochastic, tomorrow’s performance will most likely return to average – an improvement due solely to randomness, not negative reinforcement. This return to average is what statisticians call regression to the mean.
Small town fallacy
Imagine COVID-20 breaks out, and a preliminary analysis shows the top ten per capita hot spots are all small towns. What, you’d likely ask yourself, makes small towns more vulnerable?
The correct answer: They aren’t more vulnerable. At least for the purposes of this article’s hypothetical, the root cause is that small towns are both smaller and more numerous than big cities.
A thought experiment shows how this works.
Use a random number generator to model a population of 10 million cases: Randomly assign a 0 (COVID-free) to 5 million cases and a 1 (COVID-positive) to the other 5 million.
Establish 10 clusters and randomly assign 500,000 cases to each. These are the large metropolitan areas. Calculate the mean per capita rate of infection. All ten will be close to 50%.
Divide the remaining 5 million cases into randomly-selected clusters of 1,000, corresponding to 5,000 small towns. Compute the mean per capita rate of infection for each of them.
The outcome: The rate among the small-town (1,000-case) clusters will, because of their much smaller sample sizes, vary more widely than the metro areas. Some will have much higher rates, and just as many will have much lower rates.
So even if differences in COVID-20 per capita incidence are due solely to stochastic effects, major metropolitan areas will exhibit rates close to the overall 10 million case mean. Smaller municipalities will occupy the most extreme positions on the incidence scale – some will exhibit the highest rates of infection, others the lowest.
Bob’s last word: Stochastic thinking is hard, requiring constant vigilance. You’ll make a good start by familiarizing yourself with common statistical errors. This, from Wikipedia, is a good place to start.
Bob’s sales pitch: CIO.com has launched my bi-weekly feature, the “CIO Survival Guide.” It’s up right now for your interest and edification: The CIO’s missing priority .
My favorite is Simpson’s paradox. Statisticians call it the fallacy of the missing variable.
It shows up frequently when lefties claim that women are underpaid compared to men.
The truth, which is too hard for their minds to grok, is that when you compare all relevant factors that women actually make 1% more then men. Those factors include degree, gpa, experience, specialty, industry, geographical location, amount of overtime, amount of risk, and other meaningful discriminators not the least of which is the factoid that women take more time off to raise families and often do not return to the workforce thus limiting their relevant experience .
Another fallacy that is of special interest is the Black Swan. These are often caused by ASSuming that they are dealing with a normal curve. Only in real statistics a genuine normal curve goes from + infinity to – infinity. The actual curves are usually bounded at zero and go to a positive number far short of infinity. But banks and alleged economists will fit a normal curve to that data and when that Black Swan hits them the government wastes our tax money bailing out the banks and enterprises that are ‘too big to fail’.
And as to that bulls eye effect example, the way you describe it is guaranteed to get worse results. The correct way is to leave the gun pointed exactly as it was and then fire a number of shots more and only then compute the centroid of that result before resetting the sight to aim at it. If you keep adjusting after every shot you will be chasing your tail and get worse results than sighting in the statistically correct way. Which is another fallacy that I taught in my Systems Engineeriing class to our junior students.
And as to covid#19 claims, so much of the data is dirty and faked to make the statistics look like what flip flopping fascist wannabees wanted it to be, so using it is not likely to be useful except to the crats that wanted the data to prove their wildeyed claims about how dangerous covid is. Covid kills some people for sure, but there are other things that kill far more people and we don’t shut down the economy and jump off the deep end because we are afraid of dying because of them. Finally flip flopping Fauci got something right when recently he said that everyone should decide for themselves about the risk and what they do about it.
Then there’s the fallacy of ascribing all virtue to fellow members of what you perceive to be your tribe and all faults to those you think of as “them.”
My tribe is one who believes in God, TRUTH, and helping others not claiming to help them like some politicians do while actually making things worse for people so as to give more power to those politicians.
Closing down the country for covid caused 2 million excess deaths over what they claim to have ‘saved’ while forking the economy to cause logistics problems making things worse. And dont pay no never mind to their wild eyed drunken sailor spending on worthless programs that have zero value but squander resources making inflation even worse.
Your tribe is one that it is so certain it knows the truth that it considers anyone who disagrees to be evil. Remarkably enough, it also pretends to believe that humility is a virtue.
I had a high school teacher who used to say, “Figures don’t lie, but liars figure.” That is my favorite quote regarding statistics. Take them all with a grain of salt. People can make numbers say what they want them to say. You need to evaluate the details behind the numbers. Their processes, their data, their formulas, etc.
+1
But our kids are taught to just accept what they are told.
I recently read Pinker’s book Rationality – covered these and more (including disinformation) We need more rational thinkers!!
I’m working my way through Rationality now (at your recommendation – thanks!). The difference between Pinker and me is that he knows enough to fill a book. I’m happy to know enough about the subject to fill a few columns.
My favorite statistical example is called the Dead Duck:
You fire a rifle leading the flying duck by an unmeasurable distance and it misses the duck by a few feet ahead of the duck. The next shot in which you reduce the leading distance misses the duck trailing it by a few feet. Statistically the duck is dead!