Evidence is a scary thing. Faced with it, most of us have an uncanny ability to explain it away if it doesn’t fit into our preferred view of How Things Work.
Here in KJR, and in my other weekly blog, InfoWorld’s “Advice Line,” I’ve been writing for years about the difference between processes and practices and the increasing importance of the latter. My arguments relied more on logic than on evidence, though, and so, last year, we conducted a survey to try to remedy this. It’s time to look at the results.
Respondents provided their company’s two most important core business functions and supporting business functions. For each they ranked fixed cost, incremental cost, cycle time, throughput, quality, and excellence in order of importance.
63 participants provided usable responses, although some described fewer than four functions. Aggregating the two core functions and two supporting functions, we ended up with data about 123 core functions and 106 supporting functions.
To classify each function as process or practice: If incremental cost was on the list, it scored one for process; likewise if quality was on the list. Excellence and fixed cost each scored a point for categorizing the function as a practice.
Netting the process score against the practice store, functions that scored +2 counted as pure processes, +1 as processes, 0 as hybrids, -1 as practices, and -2 as pure practices.
Some respondents combined multiple functions into single responses, presumably to provide a more complete look at their companies. For example, a respondent working in the extraction sector listed exploration and production as a single function, when they really are separate functions with separate characteristics.
I decided to include these entries, so the results pertain as much to the aggregate of a company’s business functions as to individual functions.
To the results:
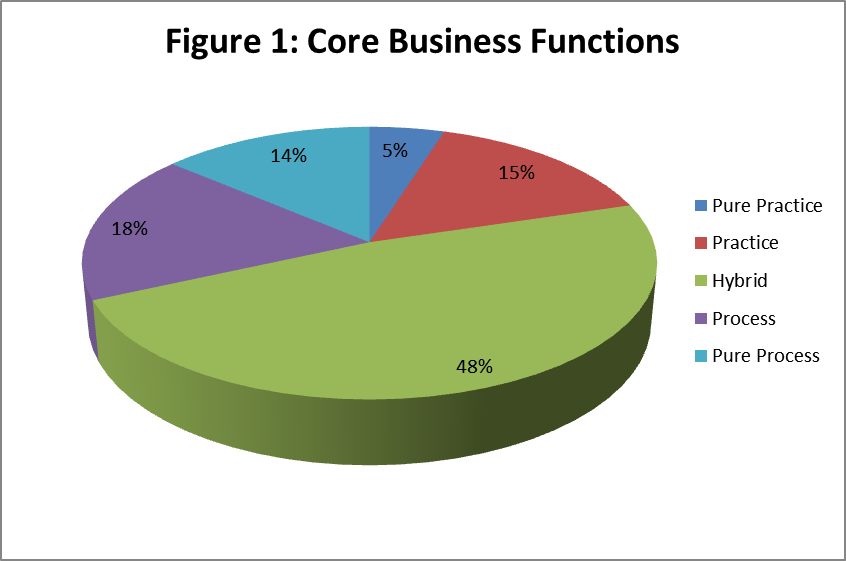
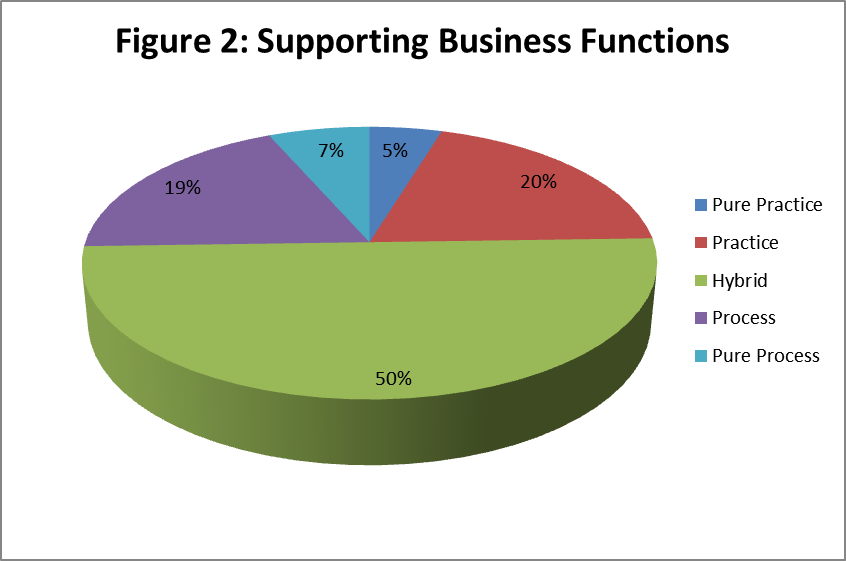
As Figure 1 and Figure 2 show, among core business functions, processes outnumber practices (32% vs 20%), while among supporting functions they’re almost perfectly split (26% vs 25%). In both cases, about half the functions have both process and practice characteristics (they’re hybrids).
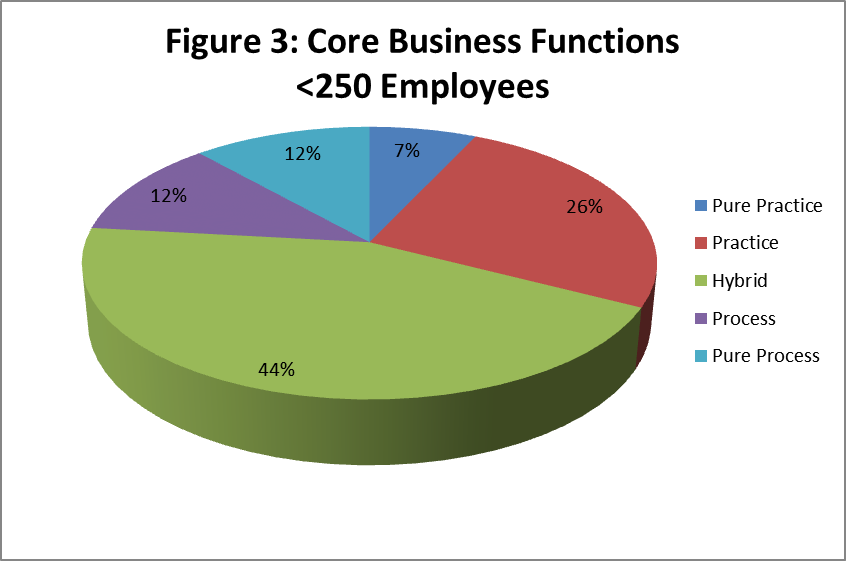
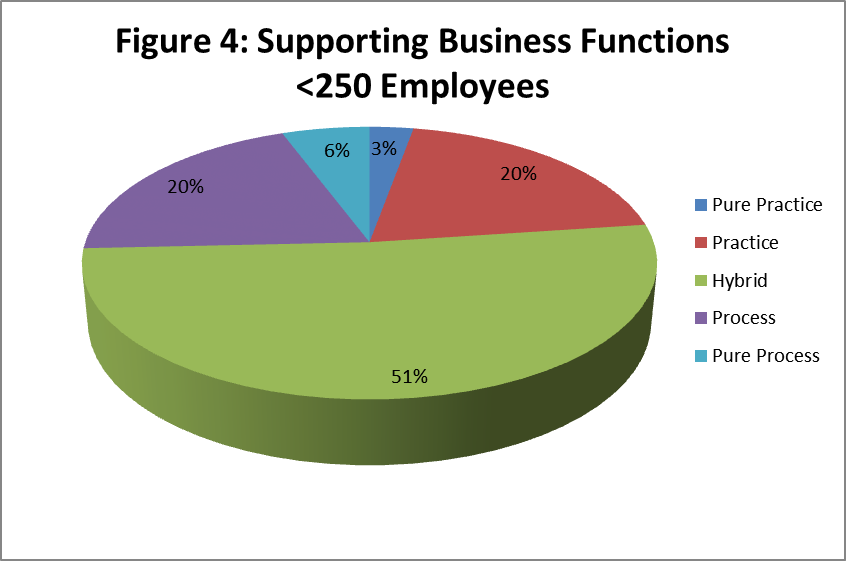
Company size matters. As Figures 3 and 4 show, the core functions of companies with 250 or fewer employees are far more practice-like than the overall average (33% qualify as practices compared to 20% for the population as a whole, n=43), while their supporting functions are little different from the population as a whole (n=35).
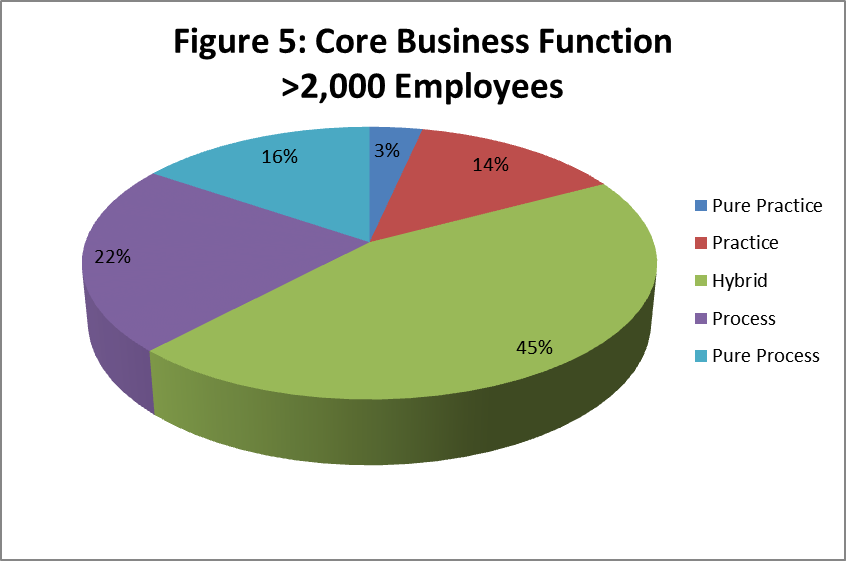
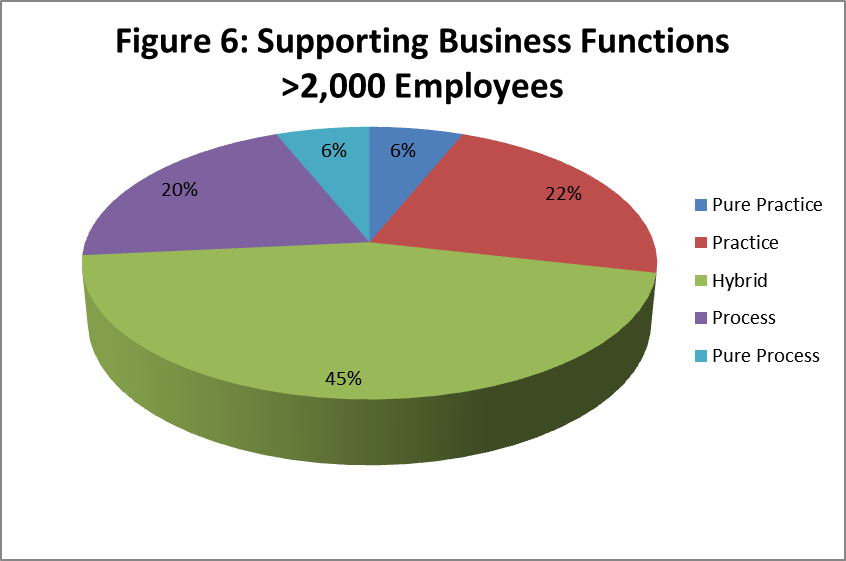
Meanwhile, as Figures 5 and 6 show, the core functions of the largest companies are, as you might expect, far more heavily weighted toward the process end of the spectrum (38% are processes while only 17% are practices, n=58). More surprisingly, their supporting functions remain evenly split — size does not appear to affect supporting functions as much as it does core functions (n=49).
How to interpret these results?
- Practices matter: I don’t owe you a retraction — phew!. Clearly, a lot of the work that takes place in 21st century businesses is properly characterized as practice … just about as much as qualifies as process, in fact.
- Size matters too: Unsurprisingly, bigger businesses organize more of their work into processes than smaller ones do. It’s unsurprising because the usual competitive advantage size confers is economy of scale — what process has to offer — while smaller companies generally compete on flexibility and agility, which come from employing practices instead.
- Beware the false dichotomy: Process and practice aren’t categorical alternatives. They’re the endpoints of a range of possibilities, and for a given business function it’s entirely reasonable … and often desirable … to get work done in ways that have both process-like and practice-like characteristics.
Here’s what matters most in all this. As is the case in two other big areas where business and IT intersect, theory has ignored half the universe or more.
The first is data management, where we have well-developed methodologies for dealing with structured data, and no methodology at all for dealing with unstructured data.
The second is applications management, where we have well-developed methodologies for designing business systems but none at all for integrating commercial off-the-shelf software.
The third is how work gets done. Starting with Deming’s statistical process control and continuing through the current “big three” business design methodologies (Lean, Six Sigma, and Theory of Constraints), we have a lot of knowledge about how to organize business processes. But business practices, which according to the evidence we finally have, constitute roughly half the work? It appears we have some methodologizing to do.
Sounds like a perfect project for some budding business PhD candidate.
Thanks to all who participated in the survey.
– Bob
This sounds like a good basis for the case study on how my former employer Arthur D. Little, Inc. failed. ADL was neatly divided into Practices based on the expertise of the consultants. Then, there were processes: the methods used to complete any consulting assignment. During the most productive years at ADL, the process was called “seat of the pants,” in which the project leader gathered all the facts, weighed the evidence, and deduced a conclusion/solution based on their experience and expertise. It worked because ADL hired only the best of the best.
Then came a new Management Consulting “process.” Any problem could be solved by interviewing enough subjects that the weight of evidence would become obvious. It didn’t work. The opinions of the experts was discarded and final reports to the client presented with absurd results. Dissatisfaction happened, and repeat business disappeared. With that bankruptcy followed. Idiocy prevailed.
A sad tale. Thanks for helping me with this analysis.
Hi Bob,
I highly recommend that you work with some people like Jon Peltier, Ed Tuftee and Steven Few (graphics, not movies) to resolve to never again use 3D pie charts – your data would make more sense if you used bar charts for comparing data.
No data analysis person that I know uses pie charts.
v/r
AH3
I agree on the use of 3D. I’ll never succumb to it again. Another correspondent pointed out that the use of 3D leads to parallax effects that can distort how people see the relative size of the slices.
Having read Tufte’s views on the subject I’m persuaded … that Tufte is far too impressed with himself. The tables of numbers he recommends have their place. They require inspection, though, which means they fail to take advantage of humans’ built-in image processing abilities. When the goal is to let people quickly compare the size of different categories, pie charts do quite a good job. And while bar charts also do a good job of this, they don’t instantly convey that the pieces represent non-overlapping categories that taken together constitute a whole … something pie charts accomplish with no verbal explanation required.
Just my opinion, of course.