“If your experiment needs statistics, you ought to have done a better experiment.” – Ernest Rutherford
Month: April 2022
Stochastic thinking
Paul Krugman revisited the so-called “Great Resignation” and concluded it isn’t really a thing. You heard it here first. Thanks for the validation, Dr. Krugman, and for demonstrating the difference between calculating statistics correctly and interpreting them properly.
Sneering at statistics is a popular pastime, with lots of clever quotes from clever people to justify the derision, and high salaries paid to the data scientists who are good at it.
Statistics is hard to get right, even without the math. Failing to appreciate the stochastic nature of the world around us … that is, the randomness that’s intrinsic to so much of our experience … is a major reason so many of us so often draw the wrong conclusions.
Three examples, drawn from Daniel Kahneman’s brilliant Thinking, Fast and Slow, help illustrate just how easy misinterpreting statistical analysis is. Call them the bulls-eye effect, regression to the mean, and the small town fallacy.
Bulls-eye effect
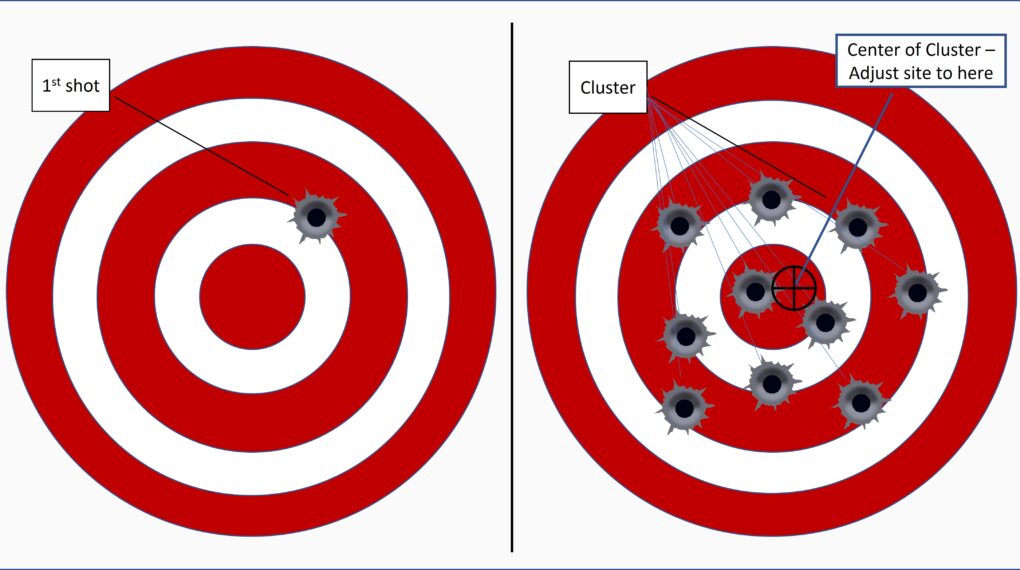
The bulls-eye effect is familiar to anyone who has ever sighted in a rifle. Here’s how it doesn’t work: (1) Put the rifle in a clamp; (2) pull the trigger; (3) realign the site so its crosshairs are pointed at the hole in the target.
Do this and pull the trigger again. This bullet won’t pass through the hole created by the previous one, and the next shot you fire probably won’t pass through either of the previous bullet holes.
The trajectory of a fired bullet is stochastic, affected by random effects. Slight variations in bullet weight, propellant quantity and composition, wind, barometric pressure, humidity, and so on all influence the path each bullet follows on its way to the target.
To properly sight in a rifle you need to fire more than one round – statisticians would recommend 30, but 10 is probably enough. Then, as Figure 1 illustrates, adjust the sight so it points to the middle of the cluster of bullet holes you produced. And, accept that whenever you use the rifle you won’t be able to perfectly predict where the next bullet will fly.
No matter which business process or practice you’re dealing with, perfection will elude you because to a greater or lesser degree, all processes and practices are subject to stochastic effects.
Regression to the mean
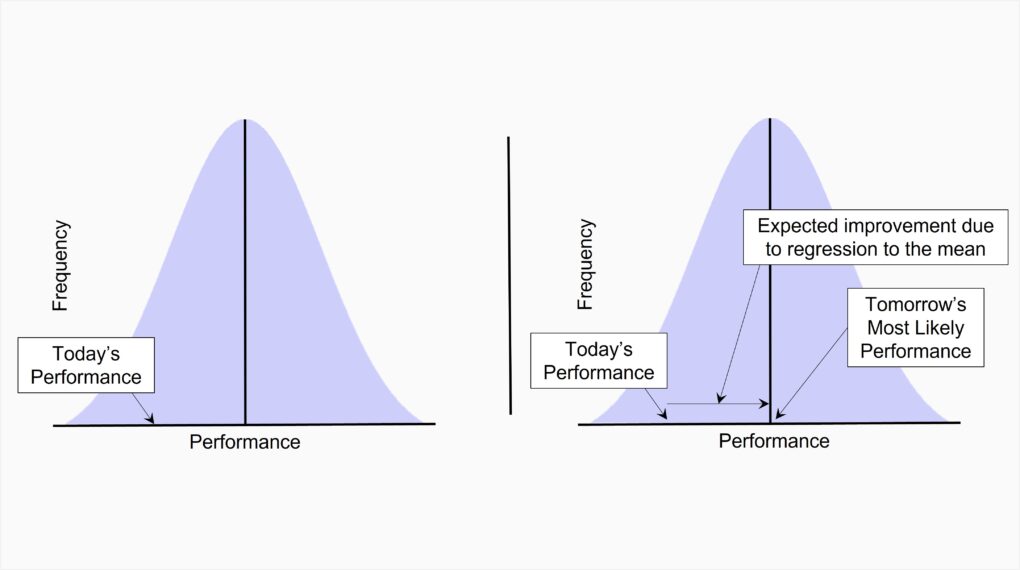
A team member does poorly at an assignment. You chew them out, and they do better at the next one. Another team member handles their assignment well. You provide positive reinforcement … you compliment them. Nonetheless they do worse their next time out.
You draw the obvious conclusion: Negative reinforcement works, positive reinforcement doesn’t. And … you drew the wrong conclusion. As shown in Figure 2, if today’s performance is below average and performance is stochastic, tomorrow’s performance will most likely return to average – an improvement due solely to randomness, not negative reinforcement. This return to average is what statisticians call regression to the mean.
Small town fallacy
Imagine COVID-20 breaks out, and a preliminary analysis shows the top ten per capita hot spots are all small towns. What, you’d likely ask yourself, makes small towns more vulnerable?
The correct answer: They aren’t more vulnerable. At least for the purposes of this article’s hypothetical, the root cause is that small towns are both smaller and more numerous than big cities.
A thought experiment shows how this works.
Use a random number generator to model a population of 10 million cases: Randomly assign a 0 (COVID-free) to 5 million cases and a 1 (COVID-positive) to the other 5 million.
Establish 10 clusters and randomly assign 500,000 cases to each. These are the large metropolitan areas. Calculate the mean per capita rate of infection. All ten will be close to 50%.
Divide the remaining 5 million cases into randomly-selected clusters of 1,000, corresponding to 5,000 small towns. Compute the mean per capita rate of infection for each of them.
The outcome: The rate among the small-town (1,000-case) clusters will, because of their much smaller sample sizes, vary more widely than the metro areas. Some will have much higher rates, and just as many will have much lower rates.
So even if differences in COVID-20 per capita incidence are due solely to stochastic effects, major metropolitan areas will exhibit rates close to the overall 10 million case mean. Smaller municipalities will occupy the most extreme positions on the incidence scale – some will exhibit the highest rates of infection, others the lowest.
Bob’s last word: Stochastic thinking is hard, requiring constant vigilance. You’ll make a good start by familiarizing yourself with common statistical errors. This, from Wikipedia, is a good place to start.
Bob’s sales pitch: CIO.com has launched my bi-weekly feature, the “CIO Survival Guide.” It’s up right now for your interest and edification: The CIO’s missing priority .